

Code: Select all
${execi 1 sensors -u | grep -A 0 'temp2_input' | cut -c 15-19} CCode: Select all
${sensors | grep -A 0 'temp2_input' | cut -18-21} CCode: Select all
${sensors} CCode: Select all
${execi 1 sensors -u | grep -A 0 'temp2_input' | cut -c 15-19} CCode: Select all
${sensors | grep -A 0 'temp2_input' | cut -18-21} CCode: Select all
${sensors} CThanks, I will know for the next time I need help with widgets. But for now a moderator could move the topic there, if they feel it's necessary.richyrich wrote: ⤴Mon Jul 30, 2018 3:23 pm Sorry I cannot help with your dilema, but I wanted you to realize there is a Mint subforum that may give you some help . .
Compiz, Conky, Docks, & Widgets
I added the '-c' and refreshed the app but it still shows the same thing.
echo $(sensors | grep -A 0 'Core 0' | cut -c 17-22)CThis works to print CPU core 0 temp in a command window. Shouldn't be too difficult to paste into Conky.${hwmon 0 temp 1}°CCode: Select all
background yes
double_buffer yes

alignment top_right

border_width 1
cpu_avg_samples 2
default_color white
default_outline_color white
default_shade_color white
draw_borders no
draw_graph_borders yes
draw_outline no
draw_shades no

gap_x 4
gap_y 4
net_avg_samples 2
no_buffers yes
out_to_console no
out_to_stderr no
extra_newline no

own_window yes
own_window_type desktop
own_window_transparent no
own_window_colour 000000
own_window_argb_visual yes
own_window_argb_value 102
own_window_hints undecorated,below,sticky,skip_taskbar,skip_pager

minimum_size 190 300
stippled_borders 0
update_interval 2.0
uppercase no
use_spacer none

show_graph_scale no
show_graph_range no

use_xft yes
xftalpha 0.1
xftfont Noto Sans:size=15
color0 FFFFFF 	#white
color1 FF0000	#red
color2 FFFF00	#yellow
color3 00BF00	#nVidia green
color4 00BFFF	#sky blue
color5 FF6700	#orange

TEXT
${color4}CPU Load ${color4}${alignr}${cpu cpu0}%
${color1}CPU Temperature ${color1}${alignr}${hwmon 0 temp 1}°C

${color5}RAM USED ${color5}${alignr}${mem} ${color0}/ ${color2}${memmax}
${color0}${membar 5,} ${color5}
${top_mem name 1} $alignr ${top_mem mem_res 1}
${top_mem name 2} $alignr ${top_mem mem_res 2}
${top_mem name 3} $alignr ${top_mem mem_res 3}

${color3}GPU ${color0}${alignr}
-------------------------------------------------
${color3}GPU Temp ${alignr}${color5}${nvidia temp} C
${color3}Fan Speed ${alignr}${color5}${execi 5 nvidia-settings -q [fan:0]/GPUCurrentFanSpeed -t} %
${color3}GPU Clock ${alignr}${color5}${nvidia gpufreq} MHz
${color3}Mem Clock ${alignr}${color5}${nvidia memfreq} MHz
${color3}Mem Used ${alignr}${color5}${execi 5 nvidia-settings -q [gpu:0]/UsedDedicatedGPUMemory -t} / ${exec nvidia-settings -q [gpu:0]/TotalDedicatedGPUMemory -t} MiB

${alignc}${color2}Filesystem used space
${color5}${alignc}${fs_used /mnt/} ${color0}/ ${color2}${fs_size}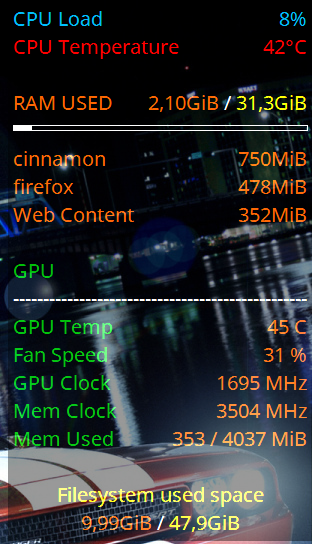
Today I discovered{hwmon 0 temp 2} shows the actual change of temperature, when the CPU is loaded by different tasks, while 'temp 1' somehow gets the temperature "stuck" at the same value for a long time and even if the temperature in the room is 18 degrees, the value remains at the high temperature you can see when outside is 40 degrees in the shade.zcot wrote: ⤴Tue Jul 31, 2018 9:53 pm just for the information value...
The current conky wiki is here: https://github.com/brndnmtthws/conky/wiki
and as the developer mentions, the ${hwmon} option is the preferred method, as opposed to exec and using sensors and grep and cut, etc.
hwmon # and temp # will be determined by the motherboard and cpu setup and kernel dealings. There's no specific documentation especially.Valsodar wrote: ⤴Thu Aug 30, 2018 3:43 pmToday I discovered{hwmon 0 temp 2} shows the actual change of temperature, when the CPU is loaded by different tasks, while 'temp 1' somehow gets the temperature "stuck" at the same value for a long time and even if the temperature in the room is 18 degrees, the value remains at the high temperature you can see when outside is 40 degrees in the shade.zcot wrote: ⤴Tue Jul 31, 2018 9:53 pm just for the information value...
The current conky wiki is here: https://github.com/brndnmtthws/conky/wiki
and as the developer mentions, the ${hwmon} option is the preferred method, as opposed to exec and using sensors and grep and cut, etc.
Unfortunately I couldn't find any options syntax or explanation of the difference between 'temp 1' and 'temp 2'.
/sys/class/hwmon and see hwmon0, hwmon1, etc. directories. And inside each of those there is file named 'name'. That will give an indication of what that hwmon # directory is dealing with. If it says nouveau, it's gpu related, if it says for example k10temp then you know it's a specific model amd cpu(this is the one I have right now). There are various modules that could be in use depending on the hardware and kernel relationship to that hardware, and you have to find the interesting one. Also inside a hwmon# directory are sets of files named temp1_* and maybe also temp2_* and possibly more and those deal with whatever is available for that piece of hardware. To get deeper into that you could dig into the specifics of a kernel module here: https://www.kernel.org/doc/Documentation/hwmon/ and/or do other web searches such as: kernel module k10temp


